WTE0 - Basics: Inputs and outputs
In this tutorial you will familiarize with the standard INPUT/OUTPUT used in DefocusTracker, which are imageset and dataset, respectively. You will also start to use the basic functions dtracker_create() and dtracker_show().
Contents
0 - Instruction
- Install DefocusTracker (see the README.md file)
- Follow the instructions and run this script cell-by-cell using the command (Ctrl+Enter).
1 - INPUT: Create an imageset
DefocusTracker takes as INPUT a set of TIFF images located into one folder. In DefocusTraker you create an imageset with the function dtracker_create(). You can create an imageset interactively:
myimageset = dtracker_create('imageset');
Or you can decleare the folder where the images are:
clc, clear, close all
myfolder = './/Datasets-WTE0//Images//';
img_myflow = dtracker_create('imageset',myfolder);
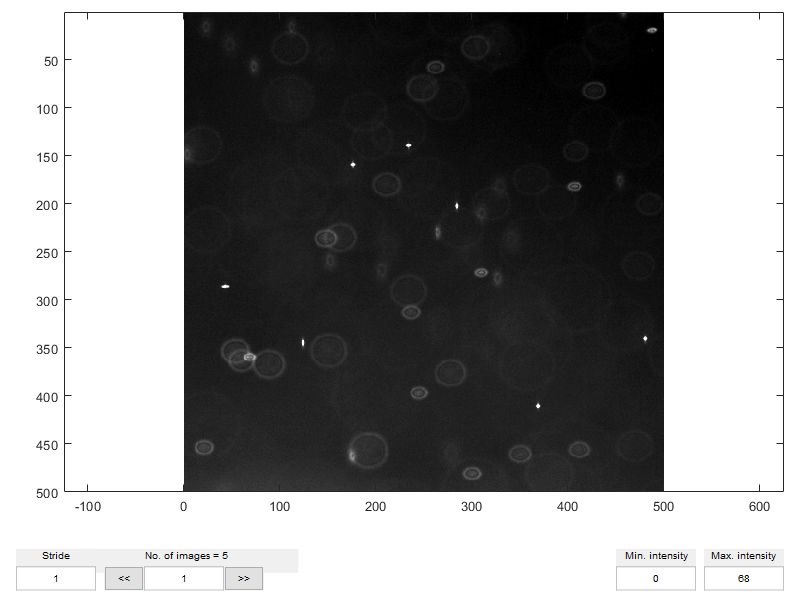
2 - INPUT: Inspect an imageset
In DefocusTracker you can interactively look at an imageset using the function dtracker_show().
dtracker_show(img_myflow)
You can output the n'th frame of an *imageset*in form of a MATLAB array using:
frame_1 = dtracker_show(img_myflow, 1);
3 - OUTPUT: Create a dataset
The OUTPUT of a DefocusTracker evaluation is a list of variables organized in a MATLAB table. A dataset is created as an output of the function dtracker_process() as shown in the following Work-Through Example 1 (WTE1).
load('.//Datasets-WTE0//datasets_wte0');
disp(head(dat_myflow)) % see first few rows
    fr      X         Y          Z         DX         DY          DZ        id       cm
    __    ______    ______    _______    _______    _______    _________    ___    _______

    1     177.07    159.29    0.93471     4.9744    -9.6497    -0.011063     98    0.97699
    1     370.26    410.62    0.92047     7.5738     -4.956     0.077649     63    0.99301
    1     21.659    454.05    0.67613    -4.9259    -4.1749     0.074475     37    0.97765
    1     408.98    145.33    0.58551     6.9115    -7.1583     0.065282     81    0.95951
    1     245.74     397.6    0.70831     3.4203    -3.4643     0.065821     20    0.98253
    1     212.21    180.68    0.53729     8.4175    -2.1569     0.029005     59    0.93188
    1     125.01    345.41    0.95751     10.073     -9.182     0.052703    132    0.95826
    1     481.48    341.04    0.92749          0          0            0      0    0.98346
By default, a DefocusTracker dataset contains 9 fields:
- fr: frame number
- X: horizontal coordinates in pixel as unit
- Y: vertical coordinates in pixel as unit
- Z: depth coordinate normalized with meas. depth (values btw 0 and 1)
- DX: horizontal displacement in pixel as unit
- DY: vertical displacement in pixel as unit
- DZ: depth displacement normalized with measurement depth
- id: identity number of one track
- cm: value rating how trustable a measurement is (values btw 0 and 1)
You can create a ZEROS dataset with n rows using:
dat_zeros = dtracker_create('dataset', 3);
disp(dat_zeros)
    fr    X    Y    Z    DX    DY    DZ    id    cm
    __    _    _    _    __    __    __    __    __

    0     0    0    0    0     0     0     0     0
    0     0    0    0    0     0     0     0     0
    0     0    0    0    0     0     0     0     0
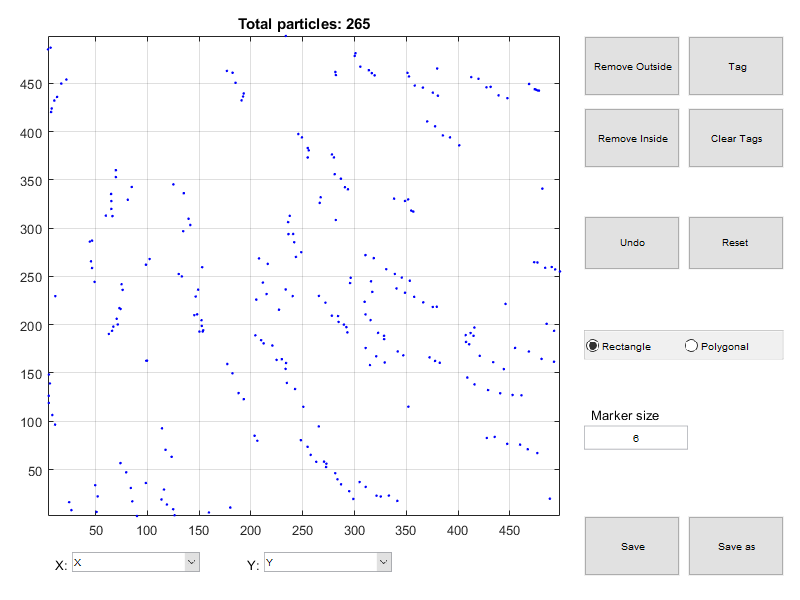
4 - OUTPUT: Inspect a dataset
In DefocusTracker you can interactively look at a dataset using the function dtracker_show().
dtracker_show(dat_myflow)
5 - OUTPUT: Work with a dataset
Here few example about how to apply flags and merge datasets. For more info on how to work with tables see the MATLAB documentation.
% Take all data in Frame 1
flag = dat_myflow.fr==1;
dat_myflow_fr1 = dat_myflow(flag,:);

% Take all data in Frame 2
flag = dat_myflow.fr==2;
dat_myflow_fr2 = dat_myflow(flag,:);

% Merge dat_myflow_fr1 and dat_myflow_fr2
dat_myflow_fr12 = [dat_myflow_fr1; dat_myflow_fr2];
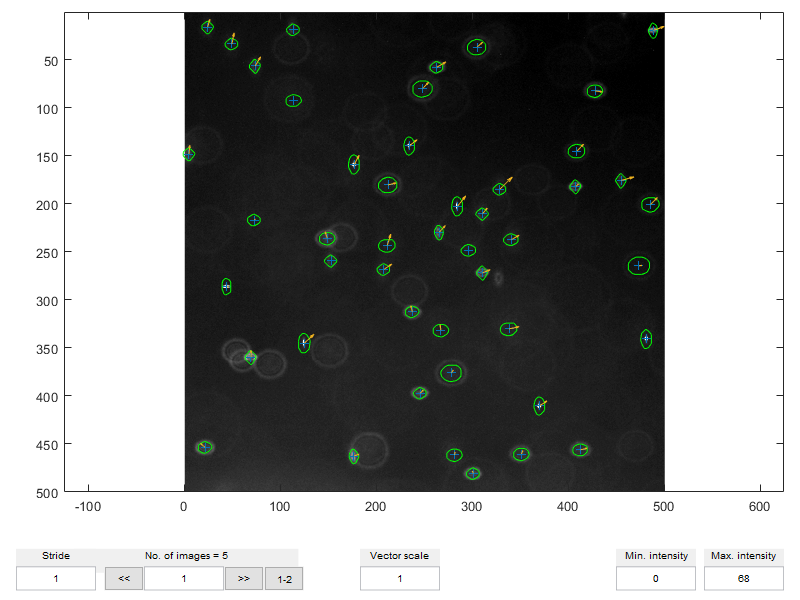
6 - INPUT & OUTPUT: Display an imageset + dataset
The function dtracker_show() can be used also to display together one imageset and the respective dataset.
dtracker_show(img_myflow,dat_myflow)